Showing posts with label #Reliability. Show all posts

Tuesday, December 2, 2025

Managing AWS Lambda Functions: Monitoring, Logging, and Debugging

Managing AWS Lambda Functions: Monitoring, Logging, and Debugging

Serverless applications simplify deployment, scaling, and infrastructure management. But when something goes wrong inside an AWS Lambda function, many beginners quickly realize that debugging a serverless workload is very different from debugging a traditional server.

There is no SSH access.
There is no long-running process to inspect.
Everything depends on good logging, solid monitoring, and smart debugging workflows.

This guide walks through how to effectively monitor, log, and debug AWS Lambda functions using Amazon CloudWatch, CloudWatch Metrics, Lambda Insights, AWS X-Ray, and practical Node.js code snippets. It is written for beginners who want to build confidence in managing serverless workloads.

Debugging Serverless Functions Feels Different

Traditional servers allow direct access to logs, processes, and system internals. Lambda does not. Instead, you rely entirely on the following:

  • CloudWatch Logs for log output

  • CloudWatch Metrics for performance and error indicators

  • Lambda Insights for deep runtime metrics

  • AWS X-Ray for tracing execution

  • Structured debugging practices

Once you understand these tools, troubleshooting becomes much easier and more predictable.

1. Logging in AWS Lambda

Logging is the foundation of all Lambda debugging. Every invocation automatically produces a log stream in Amazon CloudWatch.

Let’s start with clean, structured logging in Node.js.

Structured Logging in Node.js

    exports.handler = async (event) => {
      console.log(JSON.stringify({
        level: "INFO",
        message: "Lambda invoked",
        input: event
      }));

      try {
        const result = await processData(event);

        console.log(JSON.stringify({
          level: "INFO",
          message: "Processing succeeded",
          result
        }));

        return {
          statusCode: 200,
          body: JSON.stringify({ message: "Success" })
        };

      } catch (error) {
        console.error(JSON.stringify({
          level: "ERROR",
          message: "Processing failed",
          error: error.message,
          stack: error.stack
        }));
        throw error;
        }
      };

      async function processData(event) {
      if (!event.value) {
        throw new Error("Missing 'value' in event payload");
      }
      return `Processed: ${event.value}`;
    }

Structured logs help beginners quickly filter and search log entries inside CloudWatch, which is extremely important as applications grow.

2. Using CloudWatch Logs Effectively

Each Lambda invocation creates a log entry under:

/aws/lambda/<your-function-name>

Inside CloudWatch Logs, you can:

  • Search for specific text

  • Filter errors

  • View stack traces

  • Identify unusual behaviors

Log Retention

By default, CloudWatch Logs are kept forever. This can cause unnecessary costs.

You can set retention in the CloudWatch console or via CLI:

    aws logs put-retention-policy \
    --log-group-name "/aws/lambda/my-function" \
    --retention-in-days 14

3. Monitoring Lambda with CloudWatch Metrics

CloudWatch Metrics provides useful aggregated data:

  • Invocation count

  • Errors

  • Duration (average, p90, p99)

  • Throttling events

  • Concurrent executions

  • Cold start indicators via “Init Duration”

These metrics help identify:

  • Performance problems

  • Scaling issues

  • Increasing error rates

  • Dependency bottlenecks

For example:

  • High duration may indicate heavy computation or slow downstream services.

  • High error count indicates code or input issues.

  • Duration spikes with “Init Duration” entries in logs typically imply cold starts.

4. Using Lambda Insights

CloudWatch Lambda Insights provides deeper insights such as:

  • Memory consumed per invocation

  • CPU usage

  • Cold start frequency

  • Network usage

  • Runtime performance anomalies

You can enable it directly from the Lambda console under Monitoring Tools.

Lambda Insights is especially helpful for beginners because it clearly shows whether memory, CPU, or cold starts are the root cause of performance issues.

5. Understanding and Reducing Cold Starts

Cold starts happen when AWS needs to initialize a new runtime environment for your Lambda function. It involves:

  • Downloading your function code

  • Initializing the runtime

  • Running your global initialization code

Cold starts show up in CloudWatch Logs with "INIT_START" and "INIT_DURATION".

How to reduce cold starts

  1. Keep your deployment package small

  2. Increase memory allocation

  3. Avoid heavy initialization in the global scope

  4. Use Provisioned Concurrency

  5. Use lightweight dependencies

6. Tracing with AWS X-Ray

AWS X-Ray provides a complete view of how your Lambda interacts with AWS services. It is extremely valuable for debugging issues such as:

  • Slow DynamoDB queries

  • Timeouts calling third-party APIs

  • Slow Lambda initialization

  • Bottlenecks in downstream services

Enabling X-Ray

Lambda Console → Configuration → Monitoring → Active tracing

Debugging Workflow

Here is a structured workflow that helps beginners debug Lambda issues efficiently.

Step 1: Review CloudWatch Logs

Look for:

  • Errors

  • Stack traces

  • Validation failures

  • Missing environment variables

  • Initialization delays

Step 2: Reproduce the issue locally

Use the failing event payload to reproduce the bug.

Step 3: Improve logging

If logs are insufficient, add structured logs around:

  • External API calls

  • Data transformations

  • Conditional logic

  • Error handling

Step 4: Use X-Ray to identify latency

Check whether the delay comes from:

  • AWS service calls

  • Third-party APIs

  • Internal code execution

  • Cold starts

Step 5: Fix and redeploy

Make incremental changes and test each one.

Step 6: Validate through metrics

Review CloudWatch Metrics to ensure:

  • Errors are gone

  • Duration is stable

  • Concurrency behaves as expected

Common Beginner Mistakes

  • Logging too much or too little

  • Not handling errors gracefully

  • Ignoring log retention settings

  • Forgetting about cold starts

  • Overusing synchronous external calls

  • Not validating event payloads

Avoiding these mistakes significantly improves the reliability of Lambda applications.

Conclusion: The Takeaway

Managing AWS Lambda functions effectively requires a combination of good logging, proper monitoring, and a reliable debugging workflow. Once you become comfortable using CloudWatch Logs, CloudWatch Metrics, Lambda Insights, and X-Ray together, serverless debugging becomes far less intimidating.

Start with clear logs, build systematic debugging habits, and focus on understanding how Lambda interacts with other AWS services. Over time, these practices will help you build more reliable, scalable, and maintainable serverless applications.

Sunday, April 6, 2025

Automating Serverless Workflows with AWS Step Functions: A Beginner's Guide

Automating Serverless Workflows with AWS Step Functions: A Beginner's Guide

AWS Step Functions—a service that allows you to coordinate and chain multiple AWS services into serverless workflows. This blog is a beginner-friendly guide to understanding how to automate serverless workflows using AWS Step Functions, and we'll explore the concept through a simple but powerful Order Processing use case.

Need of AWS Step Functions

In serverless applications, you often need to chain several Lambda functions together to complete a task—such as processing orders, approving requests, or transforming data. Traditionally, you’d handle this orchestration in code, which can quickly become a maintenance headache.

AWS Step Functions let's you:

  • Visually design workflows as state machines

  • Handle retries, timeouts, and errors gracefully

  • Easily integrate with other AWS services

  • Monitor and debug workflows using the AWS Console

Use Case: Automating Order Processing Workflow

Let’s walk through a simple order processing system using AWS Step Functions and Lambda functions. The steps include:

  1. Receive Order

  2. Validate Payment

  3. Check Inventory

  4. Dispatch Order

  5. Notify Customer

Each step is implemented as an AWS Lambda function written in Node.js.

Step 1: Create the Lambda Functions

You’ll need five basic Lambda functions. Here’s a quick overview:

1. Receive Order

exports.handler = async (event) => {
  console.log("Order received:", event);
  return { orderId: event.orderId, status: "RECEIVED" };
};

2. Validate Payment

exports.handler = async (event) => {
  console.log("Validating payment for:", event.orderId);
  // Assume payment is valid
  return { ...event, paymentStatus: "VALID" };
};

3. Check Inventory

exports.handler = async (event) => {
  console.log("Checking inventory for:", event.orderId);
  // Assume inventory is available
  return { ...event, inventoryStatus: "AVAILABLE" };
};

4. Dispatch Order

exports.handler = async (event) => {
  console.log("Dispatching order:", event.orderId);
  return { ...event, dispatchStatus: "DISPATCHED" };
};

5. Notify Customer

exports.handler = async (event) => {
  console.log("Notifying customer for order:", event.orderId);
  return { ...event, notification: "SENT" };
};

Step 2: Define the State Machine

Next, use Amazon States Language (ASL) to define your workflow. Here’s a simplified version of the definition:

{
  "StartAt": "ReceiveOrder",
  "States": {
    "ReceiveOrder": {
      "Type": "Task",
      "Resource": "arn:aws:lambda:REGION:ACCOUNT_ID:function:ReceiveOrder",
      "Next": "ValidatePayment"
    },
    "ValidatePayment": {
      "Type": "Task",
      "Resource": "arn:aws:lambda:REGION:ACCOUNT_ID:function:ValidatePayment",
      "Next": "CheckInventory"
    },
    "CheckInventory": {
      "Type": "Task",
      "Resource": "arn:aws:lambda:REGION:ACCOUNT_ID:function:CheckInventory",
      "Next": "DispatchOrder"
    },
    "DispatchOrder": {
      "Type": "Task",
      "Resource": "arn:aws:lambda:REGION:ACCOUNT_ID:function:DispatchOrder",
      "Next": "NotifyCustomer"
    },
    "NotifyCustomer": {
      "Type": "Task",
      "Resource": "arn:aws:lambda:REGION:ACCOUNT_ID:function:NotifyCustomer",
      "End": true
    }
  }
}       

You can paste this into the Step Functions visual editor, replacing the Lambda ARNs with your own.

Step 3: Deploy with AWS Console or Infrastructure as Code

You can create your Lambda functions and state machine manually using the AWS Console, or automate the deployment using AWS SAM or Terraform. If you’re just starting out, the console method works great for learning.

Step 4: Test the Workflow

Once deployed, you can test the state machine by passing in an input like:

{
  "orderId": "ORDER123"
}

Go to the Step Functions console and view the execution flow. You’ll see each step execute in sequence, with logs from each Lambda function.

Benefits of This Approach

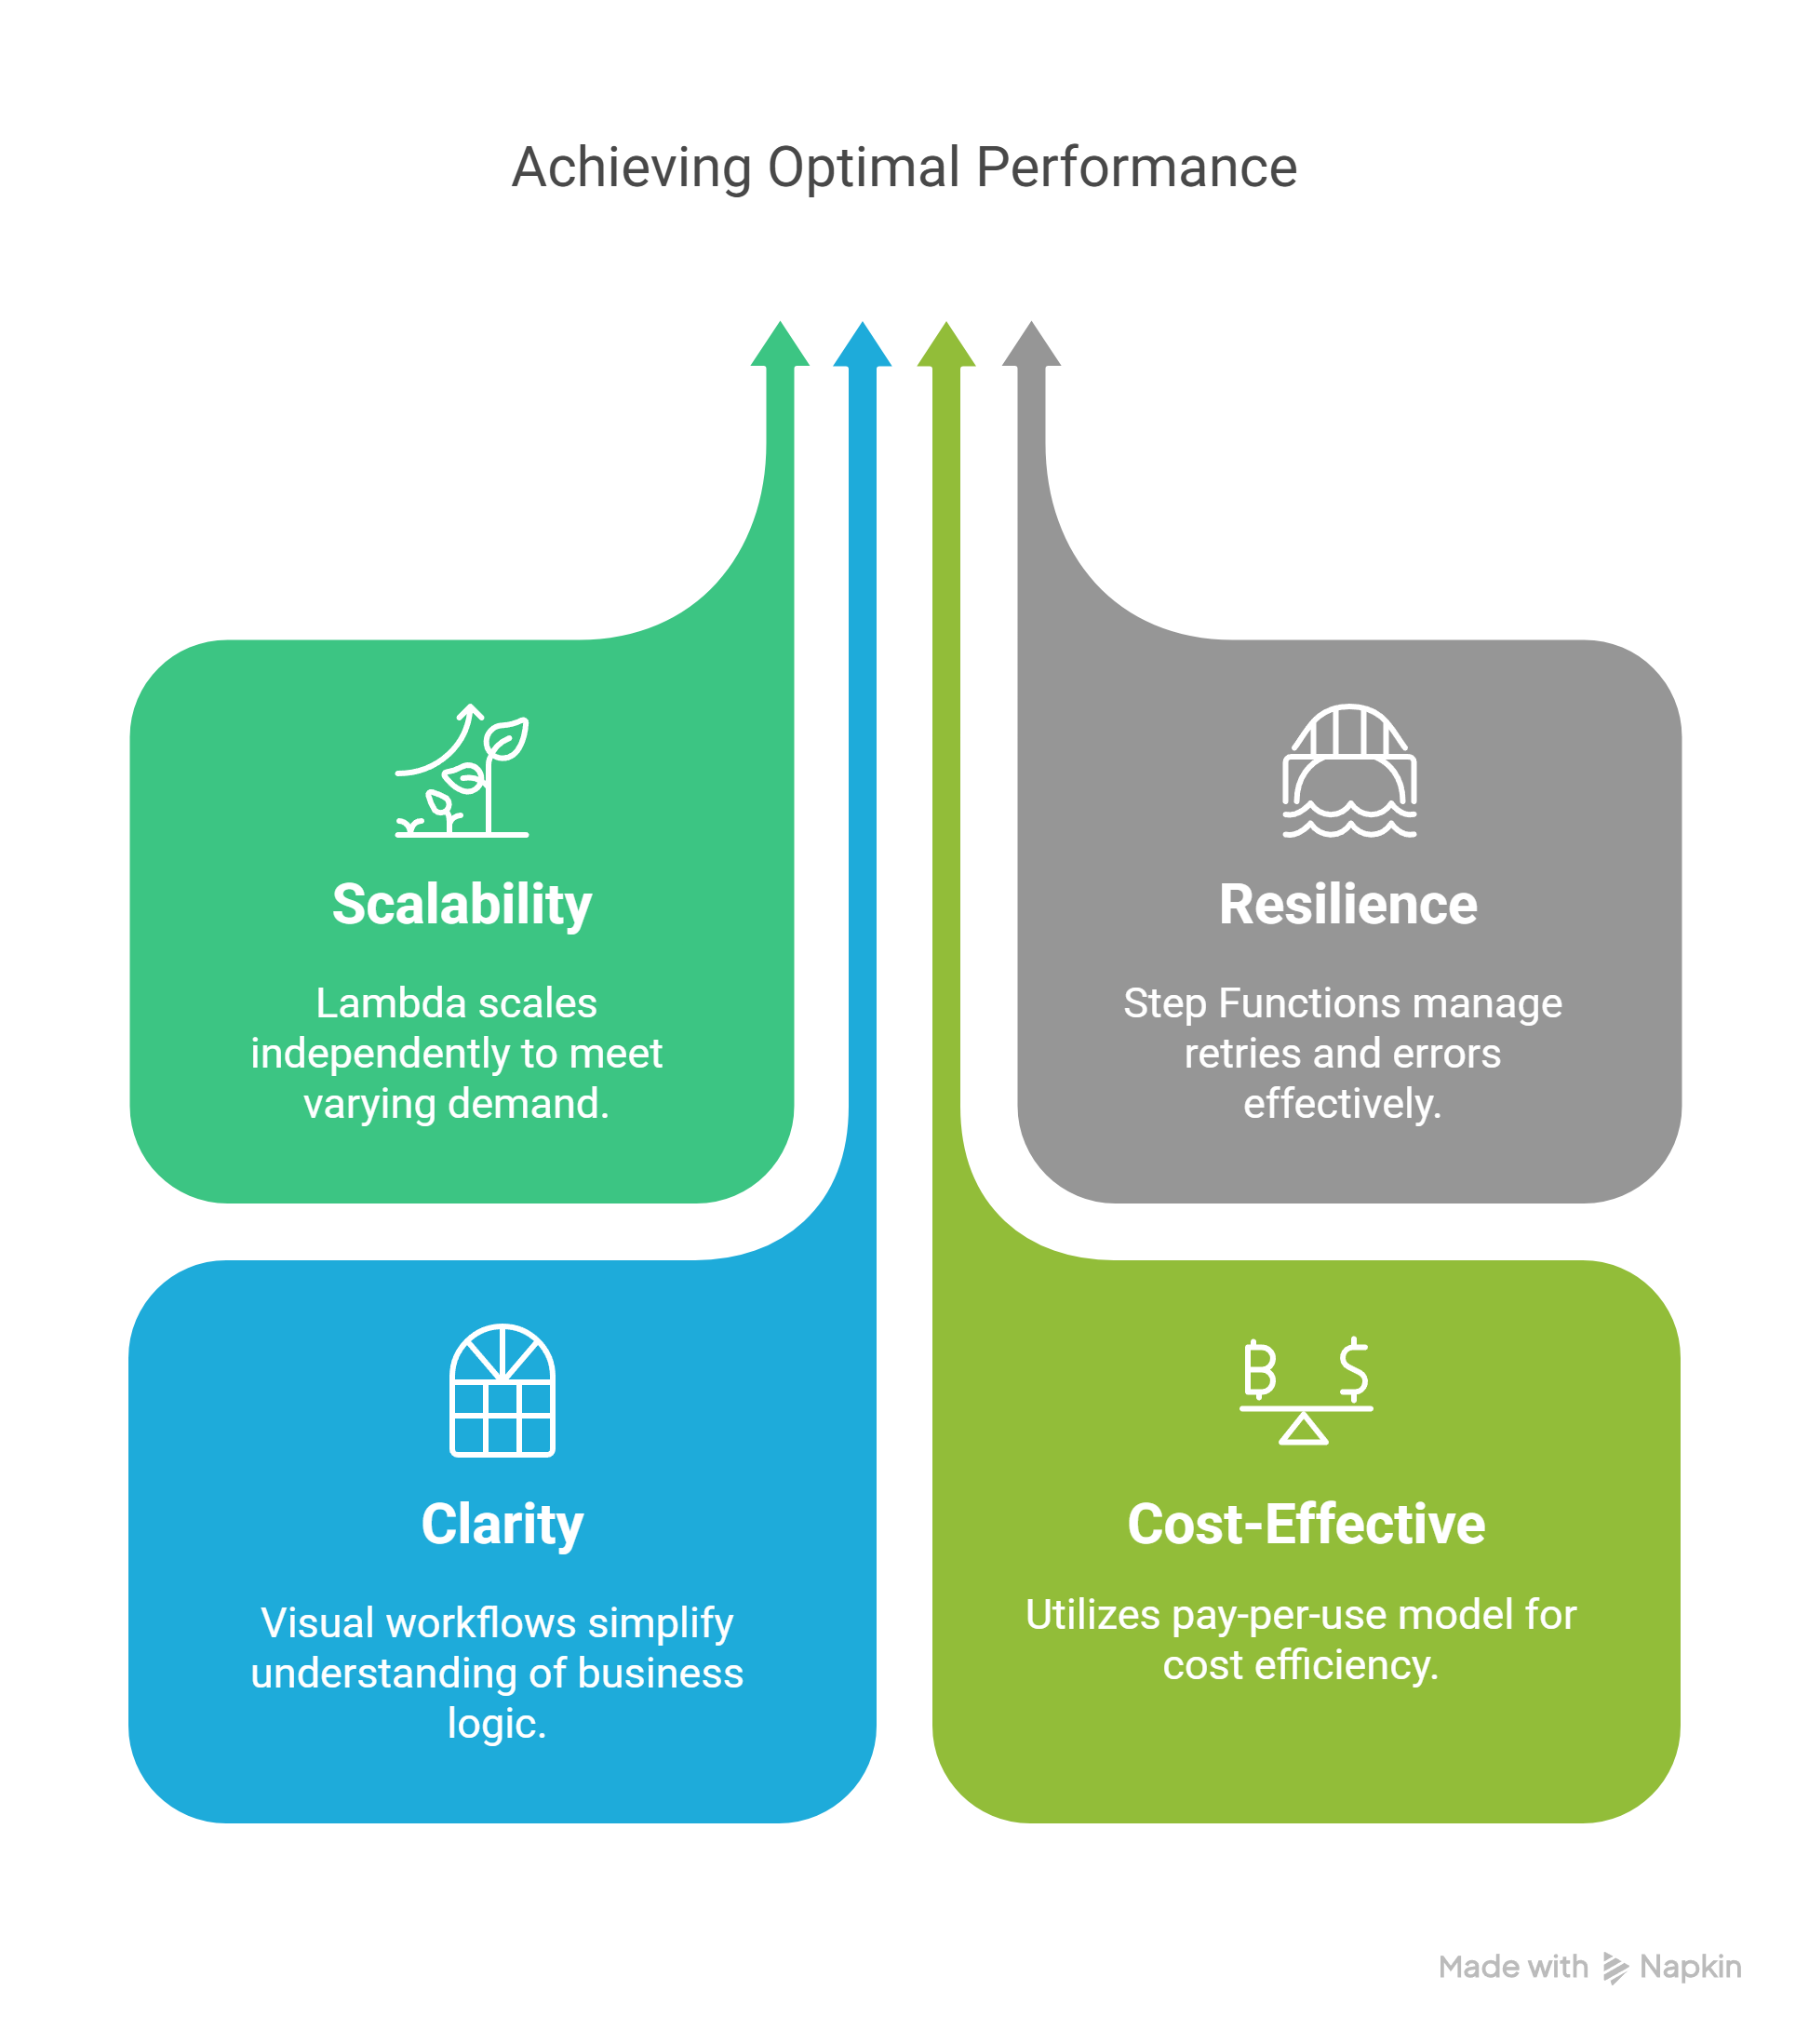
  • Scalability: Each Lambda scales independently based on demand.

  • Resilience: Step Functions handle retries and errors.

  • Clarity: Visual workflow makes understanding business logic easier.

  • Cost-Effective: Pay-per-use pricing model.

Best Practices

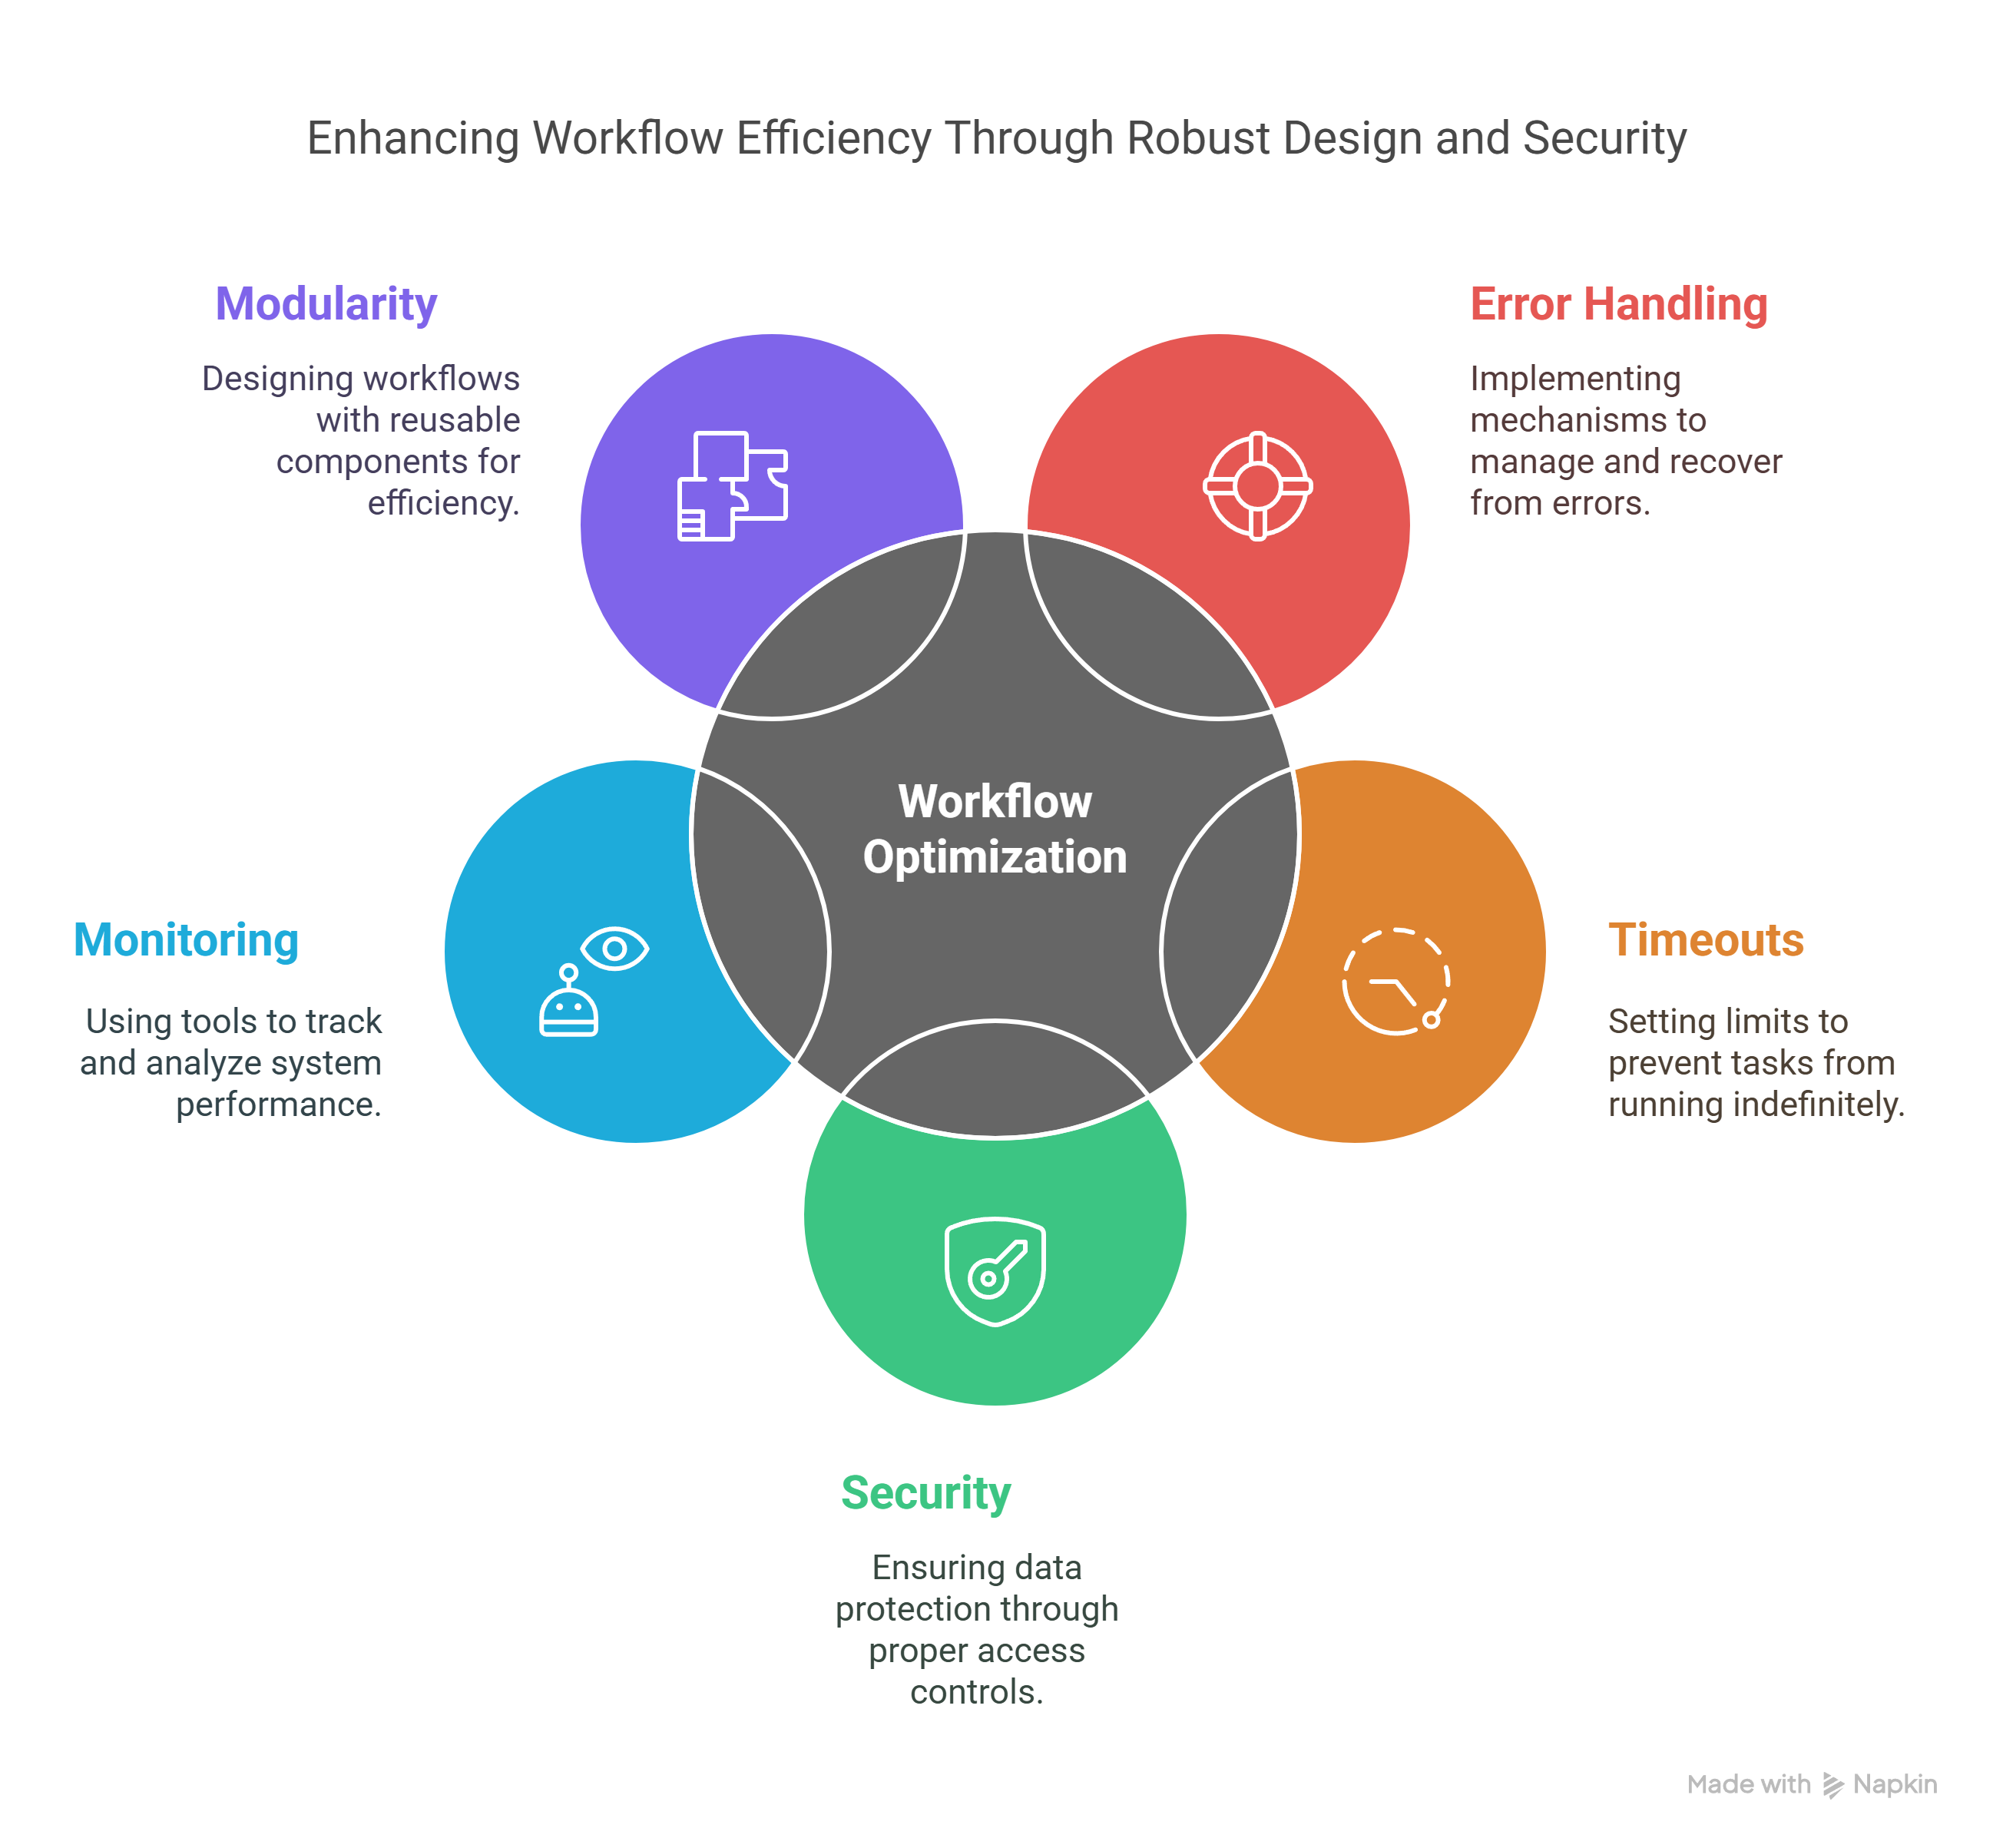
  1. Error Handling: Add Catch and Retry blocks in your state machine to gracefully handle failures.

  2. Timeouts: Define timeouts for long-running tasks.

  3. Security: Use IAM roles with least privilege for Lambda functions.

  4. Monitoring: Leverage CloudWatch Logs and AWS X-Ray for observability.

  5. Modularity: Break down your workflow into reusable Lambda functions.

Wrapping Up

AWS Step Functions are a powerful tool for orchestrating serverless workflows. By combining them with Lambda functions, you can build scalable, maintainable, and robust applications. Our order processing use case just scratches the surface—imagine the workflows you can automate in your own projects!

Ready to automate your backend logic? Give Step Functions a spin and level up your serverless architecture game.

If you enjoyed this blog, share it with your developer friends and let me know how you’re using Step Functions in your projects. Follow for more hands-on AWS content!

#AWS #Serverless #StepFunctions #NodeJS #CloudComputing #Microservices #AWSArchitecture

Sunday, February 9, 2025

Real-Time Data Processing with AWS Lambda and Amazon Kinesis

Real-Time Data Processing with AWS Lambda and Amazon Kinesis: A Beginner’s Guide

Introduction

In today’s fast-paced digital world, businesses rely on real-time data processing to gain insights, detect anomalies, and make informed decisions instantly. AWS provides powerful serverless solutions like AWS Lambda and Amazon Kinesis to handle streaming data efficiently. In this blog, we’ll explore how AWS Lambda and Amazon Kinesis work together to process real-time data, focusing on a real-time analytics use case using Node.js.

Introduction to Amazon Kinesis

Amazon Kinesis is a managed service designed to ingest, process, and analyze large streams of real-time data. It allows applications to respond to data in real time rather than processing it in batches.

Key Components of Kinesis:

  1. Kinesis Data Streams: Enables real-time data streaming and processing.

  2. Kinesis Data Firehose: Delivers streaming data to destinations like S3, Redshift, or Elasticsearch.

  3. Kinesis Data Analytics: Provides SQL-based real-time data analysis.

For this blog, we will focus on Kinesis Data Streams to collect and process real-time data.

Introduction to AWS Lambda

AWS Lambda is a serverless computing service that runs code in response to events. When integrated with Kinesis, Lambda can automatically process streaming data in real time.

Benefits of Using AWS Lambda with Kinesis:

  • Scalability: Automatically scales based on the volume of incoming data.

  • Event-Driven Processing: Processes data as soon as it arrives in Kinesis.

  • Cost-Effective: You pay only for the execution time.

  • No Infrastructure Management: Focus on writing business logic rather than managing servers.

Real-World Use Case: Real-Time Analytics with AWS Lambda and Kinesis

Let’s build a real-time analytics solution where sensor data (e.g., temperature readings from IoT devices) is streamed via Amazon Kinesis and processed by AWS Lambda.

Architecture Flow:

  1. IoT devices or applications send sensor data to a Kinesis Data Stream.

  2. AWS Lambda consumes this data, processes it, and pushes insights to Amazon CloudWatch.

  3. Processed data can be stored in Amazon S3, DynamoDB, or any analytics service.

Step-by-Step Guide to Building the Solution

Step 1: Create a Kinesis Data Stream

  1. Open the AWS Console and navigate to Kinesis.

  2. Click on Create data stream.

  3. Set a name (e.g., sensor-data-stream) and configure the number of shards (1 shard for testing).

  4. Click Create stream and wait for it to become active.

Step 2: Create an AWS Lambda Function

We will create a Lambda function that processes incoming records from Kinesis.

Write the Lambda Function (Node.js)

exports.handler = async (event) => {
  try {
    for (const record of event.Records) {
      // Decode base64-encoded Kinesis data
      const payload = Buffer.from(record.kinesis.data, 'base64').toString('utf-8');
      const data = JSON.parse(payload);
      
      console.log(`Received Data:`, data);
      
      // Simulate processing logic
      if (data.temperature > 50) {
        console.log(`ALERT: High temperature detected - ${data.temperature}°C`);
      }
    }
  } catch (error) {
    console.error('Error processing records:', error);
  }
};

Step 3: Deploy and Configure Lambda

  1. Navigate to the AWS Lambda Console.

  2. Click Create function > Choose Author from scratch.

  3. Set a function name (e.g., KinesisLambdaProcessor).

  4. Select Node.js 18.x as the runtime.

  5. Assign an IAM Role with permissions for Kinesis and CloudWatch.

  6. Upload the Lambda function code and click Deploy.

Step 4: Add Kinesis as an Event Source

  1. Open your Lambda function in the AWS Console.

  2. Click Add trigger > Select Kinesis.

  3. Choose the Kinesis Data Stream (sensor-data-stream).

  4. Set batch size to 100 and starting position to Latest.

  5. Click Add.

Step 5: Test the Integration

Use the AWS CLI to send test data to Kinesis:

aws kinesis put-record --stream-name sensor-data-stream --partition-key "sensor1" --data '{"temperature":55}'

Check the AWS Lambda logs in Amazon CloudWatch to verify that the data is processed correctly.

Best Practices for Using AWS Lambda and Kinesis

1. Optimize Lambda Execution

  • Increase memory allocation for better performance.

  • Optimize batch size to reduce invocation costs.

2. Handle Errors Gracefully

  • Implement error logging in CloudWatch.

  • Use AWS DLQ (Dead Letter Queue) for failed records.

3. Monitor and Scale Efficiently

  • Use CloudWatch Metrics to track execution time and failures.

  • Increase Kinesis shard count if throughput is too high.

4. Secure Your Stream

  • Use IAM policies to grant the least privilege required.

  • Enable data encryption using AWS KMS.

Conclusion

AWS Lambda and Amazon Kinesis provide a powerful serverless architecture for real-time data processing. Whether you're handling IoT sensor data, log streams, or analytics, this combination allows you to process, analyze, and react to data in milliseconds. By following best practices, you can build scalable, cost-efficient, and secure real-time applications on AWS.

Are you excited to try real-time processing on AWS? Start building your own solutions and let us know your experiences in the comments below! 🚀

If you found this guide helpful, share it with your network and follow for more AWS serverless tutorials!

#AWS #Lambda #Kinesis #Serverless #RealTimeData #CloudComputing #NodeJS

Saturday, November 2, 2024

Building Docker Images in AWS CodeBuild and Storing them in ECR using CodePipeline

Building Docker Images in AWS CodeBuild and Storing them in ECR using CodePipeline

Introduction

As cloud-native applications become the standard, serverless and containerized solutions have surged in popularity. For developers working with AWS, using Docker and AWS CodePipeline provides a streamlined way to create, test, and deploy applications. In this blog, we’ll discuss how to automate Docker image builds in AWS CodeBuild, set up a CI/CD pipeline using AWS CodePipeline, and push the final image to Amazon Elastic Container Registry (ECR) for storage.

Image

This guide is suitable for AWS intermediate users who are new to Docker and are interested in building robust CI/CD pipelines.

Step 1: Setting Up an Amazon ECR Repository

Amazon Elastic Container Registry (ECR) is a fully managed Docker container registry that helps you securely store, manage, and deploy Docker container images. 

Let’s start by creating an ECR repository

  1. Log in to the AWS Management Console.
  2. Navigate to Amazon ECR and click Create repository.
  3. Provide a name for your repository, e.g., my-docker-application-repo.
  4. Configure any additional settings as needed.
  5. Click Create repository.

Once created, ECR will provide you with a repository URL that will be used to push and pull Docker images.

Step 2: Preparing Your Docker Application

You should have a Dockerfile prepared for your application. The Dockerfile is a script with instructions on how to build your Docker image. Here’s an example of a simple Dockerfile:

        # Use an official node image as the base
        FROM node:14

        # Create and set the working directory
        WORKDIR /usr/src/app

        # Copy application code
        COPY . .

        # Install dependencies
        RUN npm install

        # Expose the application port
        EXPOSE 8080

        # Run the application
        CMD ["npm", "start"]

Place this Dockerfile in the root directory of your project.

Step 3: Creating the CodeBuild Project for Docker Image Creation

AWS CodeBuild will be responsible for building the Docker image and pushing it to ECR. Here’s how to set it up:

Create a CodeBuild Project

  1. In the AWS Management Console, navigate to AWS CodeBuild.
  2. Click Create build project.
  3. Name your project, e.g., Build-Docker-Image.
  4. Under Source, select your source repository, such as GitHub or CodeCommit, and provide the repository details.
  5. Under Environment, select the following:
    1. Environment image: Choose Managed image.
    2. Operating system: Amazon Linux 2
    3. Runtime: Standard
    4. Image: Select a Docker-enabled image, such as aws/codebuild/amazonlinux2-x86_64-standard:3.0
    5. Privileged: Enable privileged mode to allow Docker commands in the build.
  6. Under Buildspec, you can either define the commands directly or use a buildspec.yml file in your source code repository. For this example, we’ll use a buildspec.yml.

Creating the buildspec.yml File

In the root directory of your project, create a buildspec.yml file with the following contents:
    version: 0.2

    phases:
      pre_build:
        commands:
          - echo Logging in to Amazon ECR...
          - aws ecr get-login-password --region  | docker login --username AWS --password-stdin 
      build:
        commands:
          - echo Building the Docker image...
          - docker build -t my-application .
          - docker tag my-application:latest :latest
      post_build:
        commands:
          - echo Pushing the Docker image to ECR...
          - docker push :latest
    artifacts:
      files:
        - '**/*'
Replace <your-region> and <your-ecr-repo-url> with the actual values for your AWS region and ECR repository URL.

Step 4: Setting Up AWS CodePipeline

Now that CodeBuild is ready to build and push your Docker image, we’ll set up AWS CodePipeline to automate the build process.

Create a CodePipeline

  1. Go to AWS CodePipeline and click Create pipeline.
  2. Name the pipeline, e.g., Docker-Build-Pipeline.
  3. Choose a new or existing S3 bucket for pipeline artifacts.
  4. In Service role, select "Create a new service role."
  5. Click Next.

Define Source Stage

  1. For Source provider, select your code repository (e.g., GitHub).
  2. Connect your repository and select the branch containing the Dockerfile and buildspec.yml.
  3. Click Next.

Add Build Stage

  1. In the Build provider section, select AWS CodeBuild.
  2. Choose the CodeBuild project you created earlier, Build-Docker-Image.
  3. Click Next.

Review and Create Pipeline

Review your settings, and then click Create pipeline. Your pipeline is now set up to build the Docker image and push it to ECR whenever changes are detected in the source repository.

Step 5: Setting Up IAM Permissions

For security purposes, AWS IAM policies need to be configured correctly to enable CodeBuild and CodePipeline to access ECR. Here’s how to configure permissions:

  1. CodeBuild Service Role: Ensure the role used by CodeBuild has permissions for ECR.
  2. CodePipeline Service Role: The CodePipeline service role should have the necessary permissions to trigger CodeBuild and access the repository.
Example IAM Policy for CodeBuild:
       {
          "Version": "2012-10-17",
          "Statement": [
            {
              "Effect": "Allow",
              "Action": [
                "ecr:GetAuthorizationToken",
                "ecr:BatchCheckLayerAvailability",
                "ecr:PutImage",
                "ecr:InitiateLayerUpload",
                "ecr:UploadLayerPart",
                "ecr:CompleteLayerUpload"
              ],
              "Resource": "*"
            },
            {
              "Effect": "Allow",
              "Action": [
                "s3:GetObject",
                "s3:PutObject",
                "s3:ListBucket"
              ],
              "Resource": "*"
            }
          ]
        }

Step 6: Testing the Pipeline

With everything in place, push some changes to your source repository. CodePipeline should automatically detect the changes, trigger CodeBuild, and build and push the Docker image to ECR.

You can verify this by checking the CodePipeline console to see each stage’s status. If everything succeeds, your Docker image will be available in Amazon ECR!

Conclusion

In this blog, we explored how to build a Docker image in AWS CodeBuild and push it to Amazon ECR, all within an automated pipeline set up using AWS CodePipeline. By using these services together, you can create a scalable, efficient, and reliable CI/CD pipeline for containerized applications, without the need for managing server infrastructure.

This approach leverages the benefits of serverless infrastructure and allows you to focus more on building and deploying applications rather than managing build servers.


Saturday, August 24, 2024

Unlocking the Power of AWS Lambda and Lambda Layers

Unlocking the Power of AWS Lambda and Lambda Layers

Introduction

As organizations continue to move towards serverless architectures, AWS Lambda has emerged as a core component of modern cloud-native applications. AWS Lambda allows developers to run code without provisioning or managing servers, making it a go-to choice for building scalable and event-driven applications. However, as the complexity of Lambda functions grows, so does the need for efficient code management and reuse. This is where AWS Lambda Layers come into play.

In this blog post, we’ll dive deep into AWS Lambda and Lambda Layers, explore their use cases, common patterns, and best practices for leveraging them effectively in your serverless applications.

Image

Understanding AWS Lambda

AWS Lambda is a serverless compute service that lets you run code in response to events such as changes in data, system state, or user actions. Lambda automatically manages the compute resources, including server provisioning, scaling, and load balancing, allowing developers to focus on writing code rather than managing infrastructure.

Introducing Lambda Layers

Lambda Layers are a powerful feature of AWS Lambda that allow you to package and share common code, libraries, or other dependencies across multiple Lambda functions. Essentially, Layers provide a way to better organize your code and promote reuse, making it easier to manage dependencies and keep your functions lightweight.

Key Benefits of Lambda Layers:

  1. Code Reusability: Layers allow you to share common code across multiple Lambda functions, reducing duplication and streamlining your development process.
  2. Simplified Deployment: By separating common code into layers, you can deploy your Lambda functions faster since you don't need to package the same dependencies with every function.
  3. Version Control: Layers support versioning, allowing you to manage different versions of shared code and roll back to previous versions if needed.

Common Patterns and Use Cases

Let’s explore some common patterns and use cases for Lambda Layers with practical examples.

1. Sharing Common Libraries

Use Case: Imagine you have multiple Lambda functions that all use the same third-party library, such as a data processing library or a utility package. Instead of including this library in each function's deployment package, you can use a Lambda Layer to share the library across all functions.

Example:

1. Create a Lambda Layer:

  • Package your library code (e.g., requests library for Python) into a zip file.
  • Create a new Lambda Layer in the AWS Management Console or via AWS CLI.

2. Add the Layer to Your Lambda Functions:

  • Go to your Lambda function’s configuration.
  • Attach the Lambda Layer by selecting it from the list of available layers.

3. Code Example:

```````````````````````````````````````````````````````````
import requests  # Library from Lambda Layer

def lambda_handler(event, context):
    response = requests.get("https://api.example.com/data")
    return {
        'statusCode': 200,
        'body': response.json()
    }
```````````````````````````````````````````````````````````

2. Custom Runtime Environments

Use Case: If you need a runtime environment that isn’t provided by default, you can use Lambda Layers to include custom runtimes. This is useful for running code in languages or environments that Lambda doesn’t support natively.

Example:

1. Create a Custom Runtime Layer:

  • Develop a custom runtime environment and package it into a Lambda Layer.

2. Deploy Your Function with the Custom Runtime:

  • Attach the custom runtime Layer to your Lambda function.

3. Code Example:

```````````````````````````````````````````````````````````

# Lambda function using a custom runtime environment
def lambda_handler(event, context):
    # Custom runtime-specific code here
    return {
        'statusCode': 200,
        'body': 'Hello from custom runtime!'
    }
```````````````````````````````````````````````````````````

3. Configuration Management

Use Case: Use Lambda Layers to manage configuration settings or environment variables. This is particularly useful for managing application settings that might change over time.

Example:

1. Create a Configuration Layer:

  • Package your configuration files into a Lambda Layer.

2. Access Configuration in Your Function:

  • Load configuration settings from the Layer in your Lambda function.

3. Code Example:

```````````````````````````````````````````````````````````
import json

def lambda_handler(event, context):
    with open('/opt/config/config.json') as config_file:
        config = json.load(config_file)
    return {
        'statusCode': 200,
        'body': f"Configuration value: {config['key']}"
    }

```````````````````````````````````````````````````````````

Creating and Managing Lambda Layers

Step 1: Create a Lambda Layer

1. Package Your Layer:

  • Create a directory structure for your Layer. For example, python/lib/python3.x/site-packages/ for Python dependencies.
  • Zip the directory.

2. Create the Layer in AWS Console:

  • Navigate to the Lambda Layers section in the AWS Management Console.
  • Create a new Layer, upload your zip file, and provide a description.

Step 2: Attach the Layer to Your Lambda Function

1. Open Your Lambda Function:

  • Go to the Lambda function you want to associate with the Layer.

2. Add the Layer:

  • Under the "Layers" section, select "Add a layer."
  • Choose your newly created Layer from the list.

Step 3: Test and Deploy

1. Test Your Lambda Function:

  • Invoke your Lambda function to ensure it’s working with the Layer.

2. Deploy Your Function:

  • Deploy changes and monitor the function to ensure it behaves as expected.

Best Practices

  1. Minimize Layer Size: Keep your layers as lightweight as possible to reduce deployment time and latency. Only include the necessary dependencies and avoid adding large files unless required.
  2. Version Control: Use versioning to manage updates to your layers. This allows you to safely update or roll back layers without affecting other Lambda functions that depend on them.

  3. Share Layers Across Teams: If you’re working in a larger organization, consider creating and sharing Lambda Layers across teams. This promotes consistency and reuse of common libraries and utilities.

  4. Secure Your Layers: Ensure that your Lambda Layers do not include sensitive information, such as hard-coded credentials. Use AWS Secrets Manager or AWS Systems Manager Parameter Store to manage secrets securely.

Conclusion

AWS Lambda Layers are a powerful feature for enhancing modularity and reusability in serverless applications. By effectively using Lambda Layers, you can streamline your development process, share common dependencies, and manage custom runtimes or configurations efficiently. Implement these patterns and best practices to optimize your serverless architecture and take full advantage of what AWS Lambda has to offer.

Ready to elevate your Lambda functions? Start integrating Lambda Layers into your projects today!

Sunday, February 11, 2024

Building Regional Fault Tolerance with AWS EventBridge Global Endpoint

Building Regional Fault Tolerance with AWS EventBridge Global Endpoint


Introduction


In today's interconnected world of cloud computing, ensuring high availability and fault tolerance for applications is paramount. AWS provides robust solutions to address these challenges, one of which is the EventBridge global endpoint. In this guide, we'll explore how intermediate AWS users can leverage this feature to build regional fault tolerance for their applications.

Building Regional Fault Tolerance with AWS EventBridge Global Endpoint


Understanding Regional Fault Tolerance


Regional fault tolerance refers to the ability of an application to remain operational and accessible even in the event of failures or disruptions in a specific AWS region. By distributing resources across multiple regions and ensuring seamless failover, applications can maintain uninterrupted service for users.

Use Case: Application Reliability with EventBridge Global Endpoint


Imagine a scenario where you're running a mission-critical application that processes financial transactions. Any downtime or disruption in service could lead to significant financial losses and damage to your reputation. Leveraging the EventBridge global endpoint, you can architect your application to be resilient to region-specific failures.

Key Benefits of EventBridge Global Endpoint


  1. High Availability: By routing events through the global endpoint, you can ensure that critical events are processed even if a primary region becomes unavailable.
  2. Disaster Recovery: In the event of a regional outage, EventBridge automatically reroutes events to a secondary region, ensuring continuous operation and data integrity.

Practical Walkthrough: Setting Up EventBridge Global Endpoint


Step 1: Create two event buses in different Regions with the same name.

Step 2: Click on Craete Endpoint by navigating to Global endpoints.

Step 3: Enter custom name and description for the Endpoint.

Step 4: Select the Bus name for Primary region and another bus name in secondary region (Busname should be same in both region to avoid confusion).

Step 5: Select the Route 53 health check for triggering failover and recovery. You can create the one by clicking on "New Health Check".

Step 6: Enable the event replication and Click on "Create" button.

Make a note of endpoint id as it must be specified in PutEvents API call. (You can always get endpoint id by visiting EventBridge Endpoint console)

Testing Global Endpoints through PutEvents API


All AWS SDK supports optional "EndpointId" parameter. Mention the Endpoint id in "EndpointId" parameter, Bus name (to validate endpoint configuration) and issue PutEvents API call.

When PutEvents API call is contains "EndpointId", the events is published to Gloal endpoint and then it is re-routed to Event bus in primary region if health check is Good else re-routed to Event bus in Secondary region.

Conclusion

By leveraging the EventBridge global endpoint, Reliability and Fault tolerance of the application can be enhanced. With built-in support for high availability and disaster recovery, EventBridge is one of the powerful tool for architecting resilient and scalable cloud applications.

In an era where downtime is not an option, investing in regional fault tolerance with EventBridge is a strategic decision that ensures your applications remain resilient in the face of adversity.